
What Do Real Estate Leads Actually Cost?
A channel-by-channel breakdown of lead costs, conversion rates, and cost per closed deal — the data you need to build a lead budget that actually makes financial sense.
How much do real estate leads cost?
The average real estate lead costs about $503 in 2026, but cost per lead is a vanity metric — cost per closed deal is what counts. Channels range from near-free (referrals and SOI) to $5–$100 per lead for SEO, social, and Google Ads, up to $20–$300+ for Zillow Premier Agent — a cost per closed deal running from roughly $0 to $30,000. Below is a channel-by-channel breakdown.
1. The $503 Lead That Never Called Back
The average cost per real estate lead hit $503 in 2026 — up 12.3% from last year. That number comes from blended industry data across all paid channels, and it's the stat vendors love to cite because it makes their platform look cheap by comparison.
But here's the problem: cost per lead is a vanity metric. A $10 Facebook lead with a 1% conversion rate costs you $1,000 per closed deal. A $50 Google lead with a 10% conversion rate costs $500 per deal. The agent who obsesses over CPL leaves money on the table. The agent who tracks cost per closed transaction builds a real business.
This guide exists because nobody else publishes the full picture. Vendors show you their best-case CPL. Coaches tell you their favorite channel. Brokerages push whatever program they get a revenue share from. What you actually need is a channel-by-channel breakdown that includes the numbers vendors don't volunteer: true all-in costs, realistic conversion rates, time-to-close, and — most importantly — what each channel actually costs per closed deal.
We pulled 2025–2026 benchmark data from NAR surveys, WordStream, First Page Sage, Goliath Data, and platform-specific reporting. No affiliate links. No sponsored rankings. No vendor bias. Just the data you need to build a lead generation budget that actually makes financial sense.
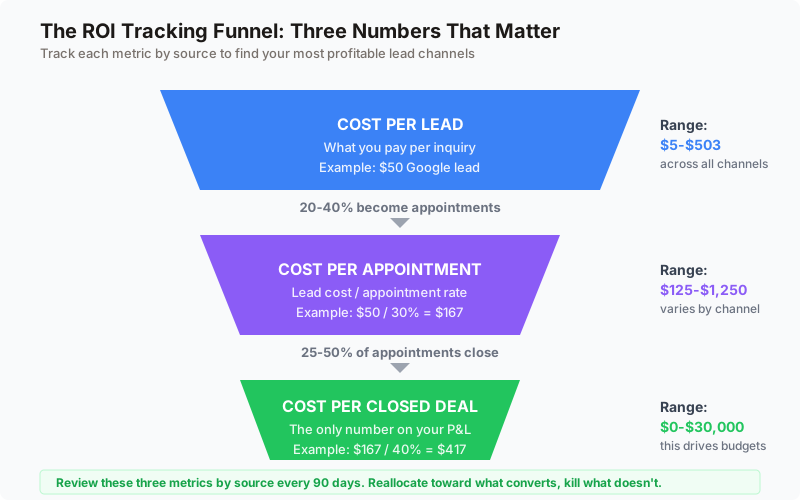
2. How to Read This Guide: The Three Numbers That Matter
For every channel we cover, you'll see three numbers:
- Cost per lead (CPL). What you pay per inquiry. This is where most comparisons start and stop. It shouldn't be.
- Conversion rate. The percentage of leads that become closed transactions. This is the multiplier that turns a cheap lead into an expensive one, or an expensive lead into a bargain.
- Cost per closed deal. CPL divided by conversion rate. This is the only number that belongs on your P&L. Everything else is marketing.
We'll also cover time-to-close (how long from first touch to commission check), effort level (passive leads vs. active prospecting), and scalability (can you 10x this channel, or does it cap out?).
| Channel | Cost Per Lead | Conversion Rate | Cost Per Closed Deal | Time to Close |
|---|---|---|---|---|
| Referrals / SOI | ~$0 | 15–25% | ~$0 | 30–90 days |
| Expired Listings | ~$200 | 20–44% | $450–$1,000 | 30–60 days |
| FSBO Prospecting | ~$150 | 13–28% | $535–$1,150 | 43 days avg |
| Google Ads (Buyer) | $20–$60 | 4–8% | $500–$1,500 | 3–6 months |
| Google Ads (Seller) | $150–$400 | 5–10% | $1,500–$8,000 | 1–3 months |
| SEO / Content | $7–$100 | 3–8% | $200–$3,000 | 6–18 months |
| Facebook / Instagram | $5–$65 | 1–3% | $500–$6,500 | 6–18 months |
| Zillow Premier Agent | $20–$300+ | 1–3% | $2,000–$30,000 | 3–12 months |
| Realtor.com | $25–$45 | 0.4–1.2% | $2,000–$11,000 | 3–12 months |
| Direct Mail Farming | $50–$150 | 1–3% | $2,500–$3,000 | 6–24 months |
| Open Houses | ~$0 (time) | <1% | Time-only | 3–12 months |
| Cold Calling | ~$0 (time) | 1–3% | Time-only | 30–90 days |
| Door Knocking | ~$0 (time) | ~2% | Time-only | 30–90 days |
3. Referrals and Sphere of Influence: The $0 Lead That Closes at 25%
Let's start with the channel that every producing agent already knows is their best: referrals and sphere of influence (SOI).
According to the NAR 2025 Profile of Home Buyers and Sellers, 66% of sellers found their agent through a referral or past relationship. That's not a rounding error — it's two-thirds of all seller transactions coming from a channel with near-zero hard cost and a 15–25% conversion rate.
The math here is almost embarrassing compared to paid channels. If you spend $200/month on a CRM to manage your SOI (send market updates, birthday texts, anniversary emails), and that produces 10 referral leads a year, your cost per lead is $240. If 20% of those close, your cost per closed deal is $1,200 — and that's before accounting for the repeat and referral business each closing generates.
In practice, most agents report referral cost per deal well under $500, because the CRM serves multiple purposes and the marginal cost of each additional referral is virtually zero.
Why Most Agents Underinvest in SOI
If referrals are so effective, why do agents pour money into paid channels? Three reasons:
- Referrals don't scale linearly. You can't 10x your sphere of influence the way you can 10x an ad budget. Growth comes from consistent relationship-building over years, not overnight spend increases.
- Referrals feel passive. There's no dashboard showing leads coming in. No metrics to optimize. For agents who want to feel like they're "doing something," paid advertising provides that dopamine hit.
- New agents don't have a sphere yet. If you moved to a new market or are in your first year, you can't rely on relationships that don't exist.
That said, every agent should be actively growing their SOI while running paid channels. The agents who treat referrals as a "nice bonus" instead of a deliberate strategy are leaving their highest-ROI channel on autopilot.
4. Expired Listings and FSBOs: The Highest-Converting Prospecting Channels
Expired listings and FSBOs sit in a category most agents avoid: active prospecting. These leads require phone calls, door knocks, and persistence. But the agents who do the work reap conversion rates that make every paid channel look anemic.
The reason these channels convert so much better comes down to one word: intent. A Zillow lead might be casually browsing homes at 11 PM on a Tuesday. An expired listing is a homeowner who already hired an agent, already staged their home, already endured showings — and is frustrated that it didn't sell. That frustration is fuel. Channel it correctly, and you have the highest-probability lead in the industry.
Expired Listings: 44% List Rate
Expired listings convert at a 44% list rate and 20.7% sold rate — the highest conversion of any lead source in real estate. The reason is simple: these homeowners already demonstrated intent to sell. The listing expired because of price, marketing, agent performance, or market conditions. They still want to sell. They just need a better plan.
The cost structure is straightforward. You need a lead list provider ($50–$150/month for services like REDX or Vulcan7), a dialer ($99–$150/month), and time. A typical agent working expired listings spends $200–$300/month on tools and 1–2 hours daily on calls. If that produces 5 listing appointments per month and 2 close, your cost per deal is roughly $750–$1,000.
The catch: this is not passive income. Expired listing prospecting requires scripts, objection handling skills, and thick skin. You'll hear "no" more than "yes." But the agents who persist through 6–8 contact attempts make the majority of connections — because nobody else does.
FSBOs: 27.8% List Rate
For-sale-by-owner leads convert at a 27.8% list rate and 13.1% sold rate, with an average cycle of 43 days from first contact to closing. Like expireds, FSBOs have already signaled intent. They're trying to sell without an agent, and a percentage of them will realize they need professional help.
NAR data shows that FSBOs represented only 5% of home sales in 2025 — the lowest share ever recorded. That shrinking pool means less competition for the agents who prospect this segment consistently.
Cost per lead mirrors expired listings: $150–$250 in tools per month, plus 1–2 hours of daily effort. The conversion timeline is shorter because FSBOs are typically more motivated (their home is actively on the market).
5. Google Ads: High Intent, High Complexity
Google Ads for real estate sits in an interesting position: the leads are higher-intent than any social platform, but the system is complex enough that most agents waste money before they figure it out.
Buyer Leads: $20–$60 per Lead
Buyer-focused Google Ads target people actively searching for homes — queries like "homes for sale in [city]," "3 bedroom houses [ZIP code]," or "[neighborhood] real estate." These leads cost $20–$60 per lead in most markets, though competitive metros push higher.
The average cost per click in real estate hit $3.22 in 2026, up 27.27% from 2024 — the largest year-over-year CPC increase of any industry tracked by WordStream. Despite affordable clicks, the conversion rate from click to lead sits at just 3.70%, among the lowest of any sector. That means you're paying for a lot of clicks that never become leads.
Where Google buyer leads shine is downstream: they convert from lead to closed deal at 4–8%, compared to 1–3% for portal leads and 1–3% for social media leads. At $42–$66 per lead and an 8% close rate, your cost per deal lands around $525–$825. That's competitive with any paid channel.
Seller Leads: $150–$400 per Lead
Seller-focused keywords — "sell my house fast," "home value estimate," "best listing agent near me" — cost dramatically more. Expect $150–$400 per lead, driven by intense competition from iBuyers, cash-offer companies, and agents targeting the same high-value keywords.
The ROI math still works if your conversion rate holds. At $250 per lead and a 7% close rate, your cost per deal is $3,571 — expensive, but potentially justified if your average listing commission exceeds $10,000.
The Complexity Tax
Google Ads isn't a set-it-and-forget-it channel. It demands ongoing optimization across multiple dimensions: keyword management, negative keyword lists, ad copy A/B testing, landing page optimization, bid strategy adjustments, quality score improvements, and conversion tracking configuration. The agents who treat Google Ads like they treat a Zillow subscription — pay and wait — inevitably waste money on irrelevant clicks and unqualified traffic.
Google Ads requires ongoing optimization. Most agents either hire an agency ($1,000–$3,000/month in management fees) or use a platform like CINC or Ylopo that manages ads on their behalf (for an additional $500–$2,000/month).
Factor in management costs and your true CPL jumps significantly. A $40 lead with $1,500/month in management fees and $1,500/month in ad spend is really a $60 lead — if you're generating 100 leads per month. At 30 leads per month, your effective CPL is $90.
| Google Ads Metric | 2024 | 2026 | Change |
|---|---|---|---|
| Average CPC | $2.53 | $3.22 | +27.3% |
| Conversion rate (click→lead) | 3.50% | 3.70% | +5.7% |
| Average CPL | ~$85 | $102.51 | +20.6% |
| Lead→close rate | 4–8% | 4–8% | Flat |
High-intent leads deserve a high-converting landing page
RobinFlow turns Google Ads traffic into qualified seller leads with branded question-flow pages. No coding, no monthly platform fees eating into your ad budget.
6. Facebook and Instagram Ads: Cheap Leads, Long Nurture
Meta's ad platforms (Facebook and Instagram) remain the most accessible entry point for paid lead generation. The barrier to entry is low, the CPL is the cheapest of any paid channel, and the targeting capabilities are unmatched. But the lead quality gap between Meta and Google is where most agents get burned.
Cost Per Lead by Type
Facebook and Instagram lead costs vary dramatically by market tier and lead type:
| Lead Type | CPL Range | Notes |
|---|---|---|
| Buyer Lead Forms | $35–$65 | Pre-filled forms, higher volume |
| Seller Leads (Home Valuations) | $15–$35 | Best CPL of any seller channel |
| Luxury Real Estate | $80–$200+ | Smaller audience, higher competition |
| Lead Form Ads (avg) | $34.10 | Most efficient format |
| Video Ads (avg) | $45.80 | Better branding, higher cost |
Market tier matters enormously. In Tier 1 markets (New York, Los Angeles, Miami), expect $35–$65 per lead. Tier 2 markets (Austin, Denver, Nashville) run $20–$45. Tier 3 and smaller markets can produce leads for $8–$20.
The NAR Settlement Effect
The 2024 NAR settlement disrupted buyer commission models and pushed more agents into paid acquisition. The result: Meta ad auction competition surged, driving CPMs up 20–35% in major metro markets during 2025. Cost per click rose from $0.74 in June 2025 to $2.60 by June 2026 — a 249% increase. Overall CPL climbed 5–10% year-over-year, from $51.90 to $54.50–$57.00.
This trend isn't slowing down. As more agents compete for attention on Meta, costs will continue rising — particularly in high-value markets where commission potential justifies aggressive bidding.
The Conversion Reality
Here's where Facebook leads disappoint: they convert at 1–3% from lead to closed deal, and the timeline is 6–18 months. These are overwhelmingly top-of-funnel leads — people who clicked a home valuation ad out of curiosity or tapped "Learn More" on a listing ad while scrolling. They're not actively buying or selling. They're browsing.
That means Facebook leads require extensive nurture: drip campaigns, retargeting ads, consistent follow-up over months. The typical journey looks like this: a homeowner clicks your "What's My Home Worth?" ad on a Tuesday night. They enter their address and email. Your CRM sends an automated valuation. Then silence. For weeks, maybe months. Six months later, that same homeowner decides it's time to sell. If your drip campaign kept them engaged — monthly market updates, neighborhood sold data, seasonal tips — they call you. If you stopped following up after week two, they call the agent whose postcard arrived that morning.
An agent who buys 100 Facebook leads at $20 each, closes 2% of them after 12 months, and earns $10,000 per deal generates $20,000 in revenue from a $2,000 lead investment. That's 10x ROI — but only if you actually follow up for 12 months. Most agents don't. Studies consistently show that 50% of agents give up after the first attempt, and 90% stop after the fourth. The agents who persist to touch six and beyond capture the majority of conversions.
7. Zillow Premier Agent: The 800-Pound Gorilla
Zillow dominates online real estate traffic. According to their own reporting, Zillow attracts over 200 million monthly unique visitors — more than any other real estate platform. That traffic concentration gives Zillow pricing power that no other portal can match, and Premier Agent pricing reflects it.
How Zillow Pricing Works
Zillow Premier Agent doesn't charge a flat per-lead fee. Instead, you purchase a "share of voice" in a ZIP code. The more you spend, the larger your share of leads in that area. This means your effective cost per lead depends on your market's property values, competition level, and how much share you buy.
| Market Type | Monthly Investment | Effective CPL |
|---|---|---|
| Small / Rural | $200–$600 | $20–$40 |
| Mid-Size Metro | $600–$1,500 | $40–$80 |
| Major Metro | $1,500–$5,000+ | $80–$200 |
| Luxury / High-Value | $3,000–$10,000+ | $139–$300+ |
| Hyper-Competitive | $20,000–$40,000+ | Varies widely |
The minimum cost to participate is $50 per ZIP code, which in competitive markets buys you virtually nothing — a sliver of lead share that produces maybe one lead per month.
Conversion Reality
Nationally, Zillow leads convert at 1–3% from lead to closed transaction. Top teams with ISAs, rapid response systems, and aggressive follow-up processes report 5–9% conversion rates. The gap between average and elite is enormous, and it's almost entirely explained by speed-to-lead and follow-up consistency.
At a 2% conversion rate, a $200 CPL produces a cost per deal of $10,000. At 5%, that drops to $4,000. At 8%, it's $2,500. Your Zillow ROI is determined less by what you pay per lead and more by what happens after the lead arrives.
The Platform Risk
Zillow's biggest risk isn't cost — it's dependency. You're renting leads from a platform that controls pricing, algorithms, lead distribution, and competitive dynamics. When Zillow shifted to Flex pricing (referral fees instead of upfront payments) in select markets, agents who had built their entire business on Premier Agent had to completely restructure their economics overnight. Agents who had diversified across multiple channels absorbed the change without disruption.
The platform risk extends beyond pricing. Zillow regularly adjusts its lead routing algorithms, changes how agent profiles are displayed, and experiments with new features that can redirect consumer attention. If your business depends on Zillow for more than 30% of your leads, you're building on rented ground — and the landlord can change the terms whenever they want. Our platform evaluation checklist covers how to score contract risk and 7 other dimensions before committing to any platform.
You also don't own the relationship until the lead converts. If a Zillow lead calls three agents simultaneously (which many do), your competitive advantage is entirely speed and follow-up quality — not brand, not marketing, not differentiation.
8. Realtor.com: Two Models, Two Math Problems
Realtor.com offers two fundamentally different lead products, and confusing them is a common — and expensive — mistake.
Traditional Lead Products: $25–$45 Per Lead
Realtor.com's standard lead products charge per lead or per month for a ZIP code territory. Non-exclusive territory access starts around $200/month, while exclusive ZIP ownership runs $1,000+ per month. Individual leads cost $25–$45 depending on market.
The challenge is conversion. Portal leads from Realtor.com convert at 0.4–1.2% nationally — lower than Zillow, likely because Zillow's larger traffic base captures more serious buyers earlier in their journey. At $35 per lead and a 0.8% conversion rate, your cost per deal is $4,375.
Connections Plus (Formerly OpCity): Pay at Close
Realtor.com's Connections Plus program (the rebranded OpCity acquisition) represents a fundamentally different approach to lead economics. Instead of charging upfront for leads of uncertain quality, it flips the model entirely: you pay nothing upfront. Instead, you owe a referral fee at closing — 30% of your commission for homes sold at $150,000 or less, and 35% for homes above that threshold. The leads are pre-qualified by a concierge team before they ever reach your phone, which means higher intent and less time wasted on tire-kickers.
On a $400,000 home with a 2.5% buyer commission ($10,000), a 35% referral fee means $3,500 goes to Realtor.com. That's your entire cost per deal: $3,500, paid only when you actually close.
The appeal is obvious: zero upfront risk. The leads are pre-qualified by a concierge team before they reach you. The downside is equally obvious: you're giving up 30–35% of your commission on every deal. For high-volume agents in expensive markets, that referral fee adds up fast.
| Realtor.com Model | Upfront Cost | CPL | Conversion | Cost Per Deal |
|---|---|---|---|---|
| Traditional Leads | $200–$1,000+/mo | $25–$45 | 0.4–1.2% | $2,000–$11,000 |
| Connections Plus | $0 | $0 | Higher (pre-qualified) | 30–35% of commission |
9. SEO and Content Marketing: The Compounding Asset
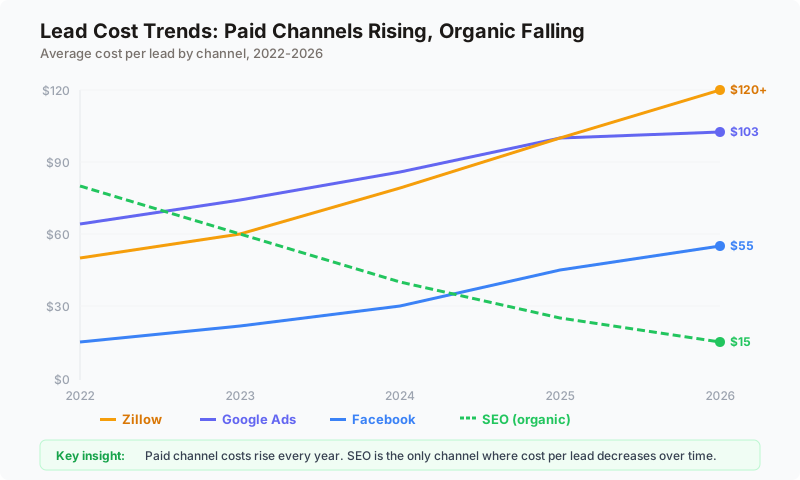
SEO is the only lead generation channel that gets cheaper over time. Every other channel on this list resets to zero when you stop spending. Organic search traffic from content you've already published keeps generating leads for months and years after the initial investment.
Cost Structure
Real estate SEO costs vary dramatically based on whether you DIY or hire an agency:
| Approach | Monthly Cost | CPL Year 1 | CPL Year 2 | CPL Year 3+ |
|---|---|---|---|---|
| DIY (agent writes content) | $0–$200 (tools only) | $50–$100 | $20–$30 | $7–$15 |
| Basic agency | $800–$2,000 | $75–$150 | $30–$60 | $15–$30 |
| Mid-tier agency | $2,000–$5,000 | $60–$120 | $25–$50 | $10–$25 |
| Enterprise agency | $10,000–$25,000 | $40–$80 | $15–$30 | $5–$15 |
The headline number: real estate SEO delivers an estimated 1,389% ROI — the highest of any industry measured by First Page Sage. Most agents break even in roughly 10 months, with the ROI accelerating as content compounds.
What "Compounding" Actually Means
The concept of compounding in SEO works exactly like compound interest in finance — each piece of content builds on the authority established by previous pieces, and the cumulative effect accelerates over time.
When you publish a neighborhood guide for "Best Neighborhoods in [Your City]," it doesn't generate leads immediately. It takes 3–6 months to index, rank, and begin attracting organic traffic. But once it does, that single page might produce 5–15 leads per month for years — at zero incremental cost. Publish 50 neighborhood guides, and you have 50 assets working for you around the clock. Each new page strengthens your domain authority, making every subsequent page rank faster and higher.
Compare this to Zillow: when you stop paying, the leads stop instantly. With SEO content, even if you stopped publishing today, the pages you've already built would continue generating leads for 12–24 months. That's the difference between renting and owning your lead flow.
Agents who publish one piece of local content per week and optimize their Google Business Profile report 15–25 inbound calls monthly. These are people who searched for a local agent, found your content, and called you — the highest-intent lead possible, at the lowest marginal cost possible.
46% of all Google searches carry local intent, and 76% of "near me" searchers visit a business within 24 hours. Real estate is inherently local. SEO is how you capture that local demand without paying a portal for the privilege.
The Timeline Reality Check
SEO's downside is patience. You won't see significant lead volume for 6–12 months. In competitive markets (Manhattan, Beverly Hills, San Francisco), it may take 12–24 months. This makes SEO a poor choice for agents who need leads next week, but an excellent choice for agents building a sustainable business over the next 3–5 years.
10. Direct Mail Farming: Old School, Still Effective
Geographic farming via direct mail is the original "content marketing" for real estate — and it still works, particularly for listing-side business in suburban and rural markets.
Cost Breakdown
A fully loaded postcard (design, printing, postage) costs $0.50–$1.50 per piece. For a 500-home monthly farm, that's $250–$750 per month. Agents using EDDM (Every Door Direct Mail) can cut postage to $0.247 per piece, reducing the cost for a 500-home farm to roughly $175 per month.
The standard benchmark for cost per closed deal from geographic farming is $2,500–$3,000. That assumes consistent monthly mailings for 12+ months before the pipeline matures. A single listing from a $1,150/month farming program pays for an entire year of mailings — and that listing often generates buyer leads, referrals, and additional listing opportunities in the same neighborhood.
Why It Still Works
Direct mail works because of repetition and physical presence in an increasingly digital world. Your postcard sits on someone's kitchen counter or gets pinned to their refrigerator. It's tangible in a way that a Facebook ad or email simply isn't — and that tactile quality creates stronger brand recall. A homeowner who has seen your postcard every month for a year has a relationship with your brand that no amount of digital advertising can replicate.
After 6–12 months of consistent mailings, homeowners in your farm area recognize your name and face. When they're ready to sell, you're the agent they think of — not the one whose Facebook ad they vaguely remember scrolling past.
The conversion timeline is long — 6–24 months for most farms to produce consistent results. But once established, a well-executed farming campaign creates a self-reinforcing cycle: listings in the farm produce "Just Sold" postcards, which generate more listings, which produce more postcards.
Direct Mail vs. Digital: Not Either/Or
The strongest farming strategies combine physical mail with digital touchpoints. Send a postcard, then retarget the same ZIP code with Facebook ads. Publish a neighborhood market update blog post, then mail a postcard linking to it. The multi-channel approach produces higher recall and faster response than either channel alone.
11. Lead Generation Platforms: What You're Really Paying For
Beyond individual channels, a category of all-in-one lead generation platforms has emerged. These companies run your ads (typically Google and/or Facebook), deliver leads to a built-in CRM, and charge a combined platform + ad spend fee. Understanding what you're actually paying matters.
Platform Pricing Comparison
| Platform | Monthly Fee | Required Ad Spend | True Monthly Cost | Best For |
|---|---|---|---|---|
| Real Geeks | $299 | $300–$500 | $600–$800 | Budget-conscious solo agents |
| BoldLeads | $399–$799 | $500–$1,000 | $900–$1,800 | Seller leads via Facebook |
| Ylopo | $495–$2,495 | $500–$2,000 | $1,000–$4,500 | AI + retargeting tech |
| CINC | $899–$1,500 | $1,000–$2,000 | $1,800–$3,500+ | Teams with ISAs |
The hidden math: when CINC advertises $899/month, that's the platform license. Add minimum recommended ad spend ($1,000+), the dialer add-on, and training, and your true monthly cost is $1,800–$3,500+. Real Geeks at $299/month looks cheap until you realize it doesn't include robust seller lead funnels. For a full head-to-head comparison of Offrs, SmartZip, BoldLeads, Ylopo, CINC, and REDX — including cost per closed deal estimates — see our seller lead platforms comparison guide.
Considering predictive analytics specifically? Our RobinFlow vs Offrs vs SmartZip guide breaks down the real costs, accuracy claims, and contract risks of predictive platforms versus intent-based question flows.
The Build vs. Buy Decision
These platforms solve a real problem: most agents don't have the skills or time to manage Google Ads, build landing pages, and configure CRM automations. The platform does it for you, and the premium you pay is for that done-for-you convenience.
But you're also paying a margin. A platform running $1,500/month in Google Ads on your behalf is charging you $899+ for the privilege of managing those ads. An agency might charge $500–$1,000 for the same management, and a skilled VA might do it for $300–$500.
The question is whether the platform's integrated CRM, AI features, and automation justify the premium. For teams running $5,000+ in monthly ad spend, the answer is often yes — the time savings and lead routing capabilities are worth it. For solo agents spending $500/month on ads, the platform fee often exceeds the ad spend itself.
Skip the platform markup
Instead of paying $899/month for a lead gen platform to run your ads, use RobinFlow as your lead capture layer and keep your ad spend working harder.
12. Traditional Prospecting: The Time-Cost Tradeoff
Cold calling, door knocking, and open houses cost almost nothing in hard dollars. Their currency is time — and in 2026, the returns on that time investment are declining.
Cold Calling: 3% Response Rate
Cold calling response rates have fallen dramatically over the past decade and a half — from 12% in 2010 to just 3% in 2026, according to NAR data. The decline reflects broader consumer behavior shifts: caller ID lets people screen unknown numbers, Do Not Call registries have expanded, and younger homeowners (millennials now represent the largest buyer demographic) overwhelmingly prefer text and digital communication over phone calls.
It now takes an average of 8 attempts to reach a prospect by phone. For an agent making 100 dials per hour, that's roughly 12 conversations and 0.36 leads per hour (assuming a 3% response rate that converts to a lead). At that rate, an agent spending 2 hours per day cold calling generates roughly 15 leads per month. If 2% close, that's 0.3 closings per month — or about 3.6 per year. Not bad for a zero-hard-cost channel, but it requires 500+ hours annually of focused, often demoralizing effort.
The agents who still succeed with cold calling typically focus it on high-conversion segments — expired listings and FSBOs — rather than random geographic cold calls. Cold calling a homeowner who has never considered selling converts at a fraction of the rate of calling one whose listing just expired. Target selection matters more than call volume.
Door Knocking: 2% Lead Rate
Door knocking produces a conversation 20% of the time (1 in 5 doors). Of those conversations, 10% generate a lead. That's a 2% lead rate per door knocked. An agent knocking 50 doors per day generates about 1 lead per day, or roughly 20 per month.
The highest-converting door knocking targets just-sold and just-listed properties, where you have a built-in conversation starter: "I just sold a home in your neighborhood for $X. Are you curious what yours might be worth?"
Open Houses: Volume Play, Low Intent
Open house sign-ins produce primarily low-intent, information-gathering leads. Less than 8% of business cards handed out at open houses result in follow-up contact. The math only works if you run open houses for listings you already have (zero incremental cost) and pair sign-ins with automated CRM follow-up.
The modernized version — digital sign-in through a tablet app that captures email and phone, then triggers a drip campaign — dramatically improves the follow-up rate. But the lead quality remains low compared to channels where prospects self-select by searching for an agent or requesting a home valuation.
13. The Speed-to-Lead Multiplier
Every channel in this guide has a hidden variable that dramatically changes its ROI: how fast you respond to leads.
The data is staggering. The average real estate agent takes 917 minutes — over 15 hours — to respond to a new lead inquiry. Meanwhile, agents who respond within 5 minutes are 21 times more likely to qualify that lead compared to those who wait 30 minutes. Responding within 1 minute increases conversions by 391% compared to a 2-minute delay.
Each minute of delay during the first five minutes reduces qualification rates by approximately 10%. After one hour, qualification odds drop by 90%. After 24 hours, you're essentially contacting a stranger who has already spoken with 3–5 other agents.
What This Means for Lead Costs
Speed-to-lead is the single biggest lever you can pull to improve ROI across every channel. Consider two agents on Zillow:
| Metric | Agent A (15 min response) | Agent B (2 min response) |
|---|---|---|
| Monthly Zillow spend | $2,000 | $2,000 |
| Leads received | 30 | 30 |
| Conversion rate | 1.5% | 5% |
| Closed deals | 0.45/month | 1.5/month |
| Cost per deal | $4,444 | $1,333 |
| Annual deals | 5.4 | 18 |
Same leads, same cost, same market. Agent B closes 3.3x more deals because they respond faster. That's not a hypothetical — it's what the conversion data consistently shows.
How to Fix Speed-to-Lead
Three practical approaches, in order of effectiveness:
- AI-powered instant response. Automated text/email within 60 seconds of inquiry. This is table stakes in 2026 — if your CRM or lead platform doesn't offer it, switch to one that does.
- ISA (Inside Sales Agent). A dedicated person whose only job is answering incoming leads immediately. Cost: $3,000–$5,000/month. ROI: positive for agents generating 50+ leads/month.
- Lead routing with accountability. Set up your CRM to route leads to the next available agent with a 5-minute response window. If they don't respond, the lead escalates to the next person. Follow Up Boss and similar CRMs support this natively.
14. Building Your Lead Generation Budget: The Portfolio Approach
No single lead channel is sufficient for a sustainable real estate business. The agents who thrive long-term build a portfolio of lead sources — just like a financial portfolio diversifies across asset classes.
The 80/20 Lead Budget
A practical framework: allocate 80% of your lead budget to 2–3 proven channels, and 20% to testing new channels. This ensures consistent deal flow while allowing you to discover what works in your specific market.
| Monthly Budget | Recommended Allocation | Expected Monthly Leads | Expected Annual Deals |
|---|---|---|---|
| Under $1,000 | SOI nurture ($200) + content creation ($0–$200) + open houses + door knocking | 10–20 | 3–8 |
| $1,000–$3,000 | SOI ($200) + Google or Facebook Ads ($500–$1,500) + SEO ($300–$1,000) | 30–80 | 8–20 |
| $3,000–$7,000 | SOI ($200) + Google Ads ($1,000–$2,000) + Zillow or platform ($1,000–$3,000) + SEO ($800–$2,000) | 60–150 | 15–40 |
| $7,000+ | Full portfolio: portals + PPC + social + SEO + direct mail | 150+ | 30–60+ |
Budget by Experience Level
Your experience level, existing infrastructure, and local market dynamics all change which channels make the most financial sense. A first-year agent in a mid-size market has fundamentally different needs and resources than a 10-year team leader in a major metro. Here's how to think about channel selection at each stage:
- New agent (year 1–2): SOI cultivation, open houses, content marketing, and one paid channel (Facebook ads for seller leads is the cheapest entry point). Skip Zillow — you can't afford the spend required for meaningful share, and you don't have the follow-up systems to convert portal leads.
- Experienced agent (year 3–7): Add Google Ads or a lead generation platform. Start geographic farming if you have a target area. Double down on SEO. Your SOI should be producing referrals by now — invest in maintaining it.
- Team leader (year 7+): Full portfolio with an ISA or AI-powered initial response. Your lead volume justifies platform costs. Your time is better spent on appointments than prospecting.
15. The Hidden Costs Nobody Talks About
Every cost comparison in the industry focuses on the lead itself. But the true cost of a lead generation channel includes infrastructure costs that vendors conveniently ignore.
CRM Costs
Every lead channel requires a CRM to manage follow-up. Budget $50–$500/month depending on your platform. Without a CRM, leads from any source die in your email inbox.
ISA or AI Response Costs
Speed-to-lead matters across all channels. An ISA costs $3,000–$5,000/month. AI-powered response tools cost $100–$500/month. Even a virtual assistant dedicated to lead response runs $1,000–$2,000/month.
Time Cost
The biggest hidden cost is your time, and most agents dramatically undervalue it. An agent earning $200,000/year across 20 transactions, working 2,000 hours annually, has an implicit hourly rate of $100. Spending 2 hours per day cold calling costs the equivalent of $200/day, or $4,000/month in opportunity cost. That "free" lead generation channel suddenly costs more than a Zillow subscription.
This doesn't mean you should never invest time in prospecting. It means you should calculate the time cost honestly and compare it to paid alternatives. If 2 hours of daily prospecting produces $4,000/month in implicit cost and 3 leads, your effective CPL is $1,333. If $2,000/month in Google Ads produces 40 leads, your CPL is $50. The paid channel is 26x more cost-effective per lead — and that's before accounting for the fact that your prospecting time could have been spent on listing appointments, client meetings, or other revenue-generating activities.
Opportunity Cost
Every dollar and hour spent on one channel is a dollar and hour not spent on another. An agent spending $3,000/month on Zillow leads that convert at 1.5% might generate more revenue by spending $1,500/month on Google Ads (higher conversion) and $1,500/month on SEO (compounding returns). The opportunity cost of channel selection is real but rarely calculated.
Platform Switching Costs
Annual contracts, data migration complexity, and retraining create switching costs that lock agents into suboptimal platforms. Before committing to any lead generation platform or CRM, ask about data export options, contract terms, and what happens if you leave. If the vendor can't clearly answer those questions, they're counting on lock-in, not quality, to keep you.
16. Channel Comparison: Cost Per Closed Deal Rankings
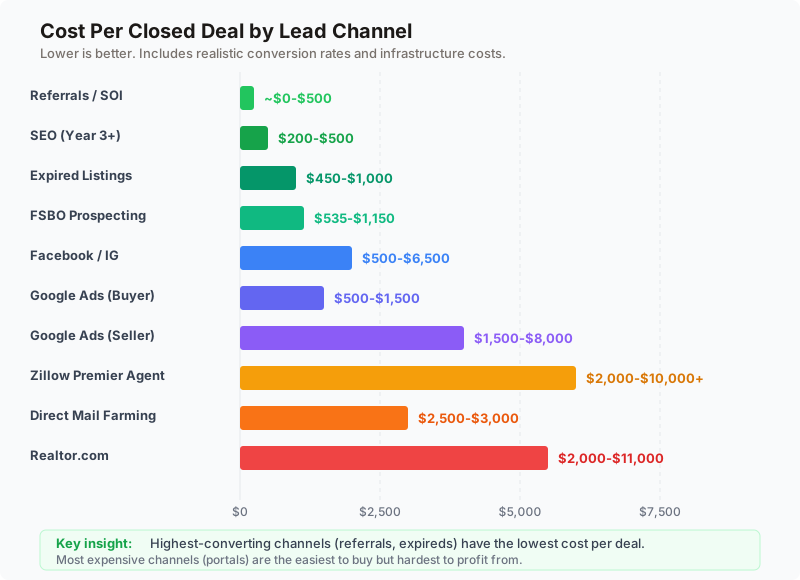
Here's the full ranking of every channel by the metric that actually matters — cost per closed deal. This table incorporates realistic conversion rates, infrastructure costs, and time-to-close estimates for each channel.
| Rank | Channel | Cost Per Deal | Conversion Rate | Scalable? | Time to Close |
|---|---|---|---|---|---|
| 1 | Referrals / SOI | ~$0–$500 | 15–25% | Limited | 30–90 days |
| 2 | Expired Listings | $450–$1,000 | 20–44% | Moderate | 30–60 days |
| 3 | FSBO Prospecting | $535–$1,150 | 13–28% | Moderate | ~43 days |
| 4 | Google Ads (Buyer) | $500–$1,500 | 4–8% | High | 3–6 months |
| 5 | SEO / Content (Yr 3+) | $200–$500 | 3–8% | High | 6–18 months |
| 6 | Direct Mail Farming | $2,500–$3,000 | 1–3% | Moderate | 6–24 months |
| 7 | Facebook / Instagram | $500–$6,500 | 1–3% | High | 6–18 months |
| 8 | Google Ads (Seller) | $1,500–$8,000 | 5–10% | High | 1–3 months |
| 9 | Zillow Premier Agent | $2,000–$10,000+ | 1–5% | High | 3–12 months |
| 10 | Realtor.com (Traditional) | $2,000–$11,000 | 0.4–1.2% | Moderate | 3–12 months |
| 11 | Connections Plus | 30–35% commission | Pre-qualified | Moderate | Varies |
Notice something? The cheapest cost-per-deal channels (referrals, expireds, FSBOs) are the ones that require the most skill and effort. The most expensive (portals) are the easiest to buy. There's an inverse relationship between convenience and cost-efficiency, and every agent's budget should reflect where they fall on that spectrum.
Also note the scalability column. Referrals and prospecting channels have natural ceilings — there are only so many expired listings in your market, and your sphere can only grow so fast. Paid digital channels (Google Ads, Facebook, Zillow) scale with budget, making them essential for agents targeting aggressive growth. The smartest agents layer high-conversion, low-scale channels (referrals, expireds) with scalable paid channels (PPC, social) and compounding owned channels (SEO), creating a pipeline that's both efficient and expandable.
17. ROI Tracking: The System That Makes This Data Actionable
All of these benchmarks are useless if you don't track your own numbers. Industry averages are just that — averages. Your market, your skills, and your follow-up systems will produce different results. The only way to make smart budget decisions is to track your own cost per deal by source.
The ROI Tracking Checklist
Every 90 days, review these metrics for each lead source:
- Cost per lead by source. Not blended. Per source. If your CRM doesn't tag lead source automatically, fix that today.
- Cost per appointment by source. This is the first real signal of lead quality. A channel that produces appointments cheaply is worth investing in, even if the CPL looks high.
- Cost per closed deal by source. The final truth. This is the only number that should drive budget allocation decisions.
- Speed-to-lead by source. Are some sources getting faster response than others? If your Zillow leads get immediate attention but your Facebook leads sit for hours, your Facebook ROI is artificially depressed.
- 90-day rolling averages. Don't make budget decisions based on a single month. Lead generation is cyclical and seasonal. Use 90-day windows for meaningful trends.
- Lifetime value by original source. A referral client who sends you 3 more referrals over 5 years has a lifetime value far exceeding a portal lead who closes once and disappears. Factor this into your channel ranking.
Ready to lower your cost per deal?
Launch a branded seller landing page, capture and qualify leads automatically, and push them to your CRM — all without a platform subscription.
Get Started Free18. What the 2026 Data Tells Us: Three Industry Shifts
Looking at the data holistically, three macro trends are reshaping real estate lead economics in 2026:
Shift 1: Paid Lead Costs Are Rising Faster Than Commissions
The average CPL hit $503, up 12.3% year-over-year. Google Ads CPC rose 27.3%. Facebook CPMs surged 20–35% in major metros. Meanwhile, the median home price increased 4–5% and average commission rates compressed post-NAR settlement. The margin between lead cost and commission income is shrinking. Agents who don't find more efficient channels — or dramatically improve their conversion rates — will see their lead generation become unprofitable.
Shift 2: AI Is Collapsing the Speed-to-Lead Gap
In 2024, agents who responded quickly had a massive advantage because most competitors took hours. In 2026, AI-powered response tools are making instant initial contact the default for agents who use modern platforms. The competitive advantage is shifting from "who responds first" to "who provides the best second and third touchpoints." Human skill and market knowledge are becoming the differentiators again, just at a faster cadence.
This shift has significant implications for lead economics. As instant response becomes table stakes, the agents who win will be those who combine speed with substance — personalized market insights, neighborhood-specific data, and genuine expertise that no chatbot can replicate. The initial contact gets you in the door. Everything after that determines whether you close.
Shift 3: Owned Media Is Becoming the Moat
As paid channel costs rise and portal algorithms change, the agents with the most durable competitive advantages are those who own their lead generation assets: SEO content, email lists, SOI databases, and branded landing pages. These assets don't get more expensive when Zillow raises prices or Meta changes its algorithm. They compound regardless of what any platform does.
Think of it like real estate itself: you can rent office space, or you can own the building. Renting (buying portal leads) gives you immediate access but builds no equity. Owning (building content, growing your email list, nurturing your sphere) requires upfront investment but creates an appreciating asset. The agents who are building owned media today are constructing a competitive moat that will widen every year while their competitors' lead costs climb.
The smart money in 2026 is flowing toward owned channels. The agents who diversify their lead sources across owned and rented channels will weather the next pricing shock. The ones who are all-in on portals are running on a treadmill that gets faster every year.
19. Key Takeaways
If you take nothing else from this guide, remember these five principles:
- Cost per lead is a vanity metric. Cost per closed deal is the only number that belongs on your P&L. A $10 lead that never converts is infinitely more expensive than a $200 lead that closes.
- Speed-to-lead is the cheapest ROI improvement you can make. Responding in 2 minutes instead of 15 hours increases conversion by up to 21x. Fix this before spending another dollar on lead generation.
- Diversify your lead sources. No single channel is sufficient. Build a portfolio of 3–4 sources, including at least one you own (SOI, content/SEO) and one you rent (paid ads, portals).
- SEO is the only channel that gets cheaper over time. Every other channel resets to zero when you stop spending. Start publishing local content today — in 12 months, you'll have an asset that generates leads at $7–$15 each.
- Track everything by source. Set up source attribution in your CRM. Review cost per closed deal by source every 90 days. Reallocate toward what works. Kill what doesn't.
20. What Comes Next
You now have the data to build a lead generation budget based on real economics instead of vendor promises. Here's how to put it into action:
Optimize your conversion infrastructure first. Before spending more on leads, ensure you're converting the ones you have. Our home valuation funnel guide shows you how to build a branded lead capture experience that qualifies sellers before they ever reach your inbox — turning cold traffic into warm conversations.
Build landing pages that convert. Every paid channel performs better when it sends traffic to purpose-built landing pages instead of generic websites. Our seller lead landing pages guide covers the exact elements, copy frameworks, and design patterns that produce 15–30% form completion rates.
Choose the right CRM to manage it all. Your lead sources are only as effective as the system that manages follow-up. Our CRM comparison guide breaks down the four platforms that dominate the market in 2026 — with pricing, features, and honest assessments of which one fits your business model.
Start generating leads today. If you're an agent who wants to start capturing seller leads through a branded, high-converting funnel — without committing to a $2,000/month platform — RobinFlow gives you that front door. It works with any CRM, any ad channel, and any budget. Your leads, your brand, your data. Get started free.
The agents who win in 2026 aren't the ones who spend the most on leads. They're the ones who spend the smartest — tracking every dollar, converting every lead faster, and building assets that compound over time. The data in this guide gives you the benchmarks. Your CRM gives you the tracking. Your follow-up systems give you the conversion advantage. And your owned content gives you the compounding moat that no competitor can buy their way past.
You have the data. Now go build the system.